Forensics Visualizations as a catalyst for fighting organized crime
Every-day challenges faced by LEAs
Criminals often employ sophisticated technologies in planning and executing their illegal activities, as well as concealing the revenues stemming from them. Suppressing organized crime remains an important but challenging task for Law Enforcement Agencies (LEAs) for several reasons, such as:
- The growing variety of heterogeneous data that need to be collected, filtered, analysed and secured. Given the omnipresence of digital technologies in our lives, virtually any type of crime has a digital forensics component. This data can be structured (e.g., call detail records) or unstructured (e.g., audio from lawfully intercepted conversations, video from CCTV systems, text communications in social media groups, etc.).
- The velocity of this data also tends to be high; large cases involve tens of subjects and each one of them may use several devices, some of them only once (“burner phones”).
- The size of data that need to be processed grows further as some cases may last for several years resulting in thousands of recorded communications.
- The large number of cases that need to be investigated. For example, according to the latest “Report of Interception of Communications Commissioner Annual Report for 2016”, some 3,007 new interception warrants were issued in UK. These warrants usually involve several individuals.
The ROXANNE Platform
The ROXANNE platform will enhance criminal network analysis capabilities by providing a suite of multi-modal technologies for extracting evidence and actionable intelligence. Nevertheless, machine-driven analysis is not a silver bullet and has its limitations, e.g., non-zero false positive rates, mandate human expertise and judgement to complete the investigation. Thus, the intention of ROXANNE project is not to replace humans but to automate the most time-consuming tasks and support investigators’ decision-making and boost their quality and productivity.
In this context, visualisation plays a key role in augmenting the human analysis and providing context to the analyst. Especially in rapidly changing situations, the ability to focus on the important, rather than the mundane, is key to establishing situational awareness. In most cases it is the linkages between the data that convey information and not the data itself.
Key elements of an effective Forensics Visualization scheme
An effective forensics visualisation scheme should tackle the challenges mentioned above and provide an environment that makes the discovery, creation and presentation of these relationships as easy and as natural for the analyst as possible. Furthermore, it should be user-centric and intuitive, while avoiding too much clutter that may confuse the operator,; or even worse result ining to wrong assumptions. Thus, the investigator should be able to configure their dashboard, e.g., choose and arrange the set of diagrams to appear, combining different types of data and along several dimensions (social, temporal, spatial, topic).
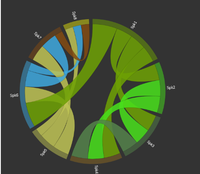
While, bar charts, pie charts, bubble charts and span charts are standard ways for reporting statistics about the suspects and the events witnessed, understanding a criminal organisation’s structure and “modus operandi” requires intuitive visualisation schemes that present the outputs of advanced algorithms for network analysis. Network graphs and chord diagrams are ideal for displaying the inter-relationships between suspects. In the latter case for example, individuals would be arranged radially around a circle and interactions are drawn as arcs connecting them. The width of those arcs could depend on the frequency and/or duration of interactions. By selecting a certain individual, the operator can see personal details (if available) and filter interactions. This way, end users can get situational awareness of the system (where original data come from) at any given time and identify patterns.

Figure 1: A screenshot from AEGIS Forensics Visualisation Toolkit showing a Chord diagram of phone calls taken place.
Another important visualiszation element are time-line charts for providing insights on the events, such as phone calls, involving selected suspects during a configurable time-window. Through the timeline control, the end user may move back in time and see details about past, or future, related events and compare two different time points, in order to get insights of the data.

Figure 2: A screenshot from AEGIS Forensics Visualisation Toolkiikt showing that some suspects were far more active compared to others before and after a key event (callers appear on the vertical axis, timing of call shown on the horizontal axis while info about destinations is presented on the main part).
In conclusion, as digital crimes continue to rise, the need for digital forensics also increases. It is the single easiest way for the human brain to interpret information. By leveraging intuitive forensics visualisation schemes, investigators will be able to discover more and new information that they might otherwise have missed and get to the key evidence in a much more efficient manner suitable for growing data volumes.
References:
1. Digital forensics is the scientific examination and analysis of data held on, or retrieved from, computer storage media in such a way that the information can be used as evidence in a court of law.
2. UK Interception of Communications Commissioner’s Office “Report of Interception of Communications Commissioner Annual Report for 2016”, December 2017 available online at https://www.ipco.org.uk/docs/iocco/CCS207_CCS1217634744-1_IOCCO_ARA_16-17.pdf

